Research Notes

All posts are automatically written using AI. These notes document methods, results, limitations and next steps; each entry has its own stage of progress and scope of validation.

All notes02

Newest first

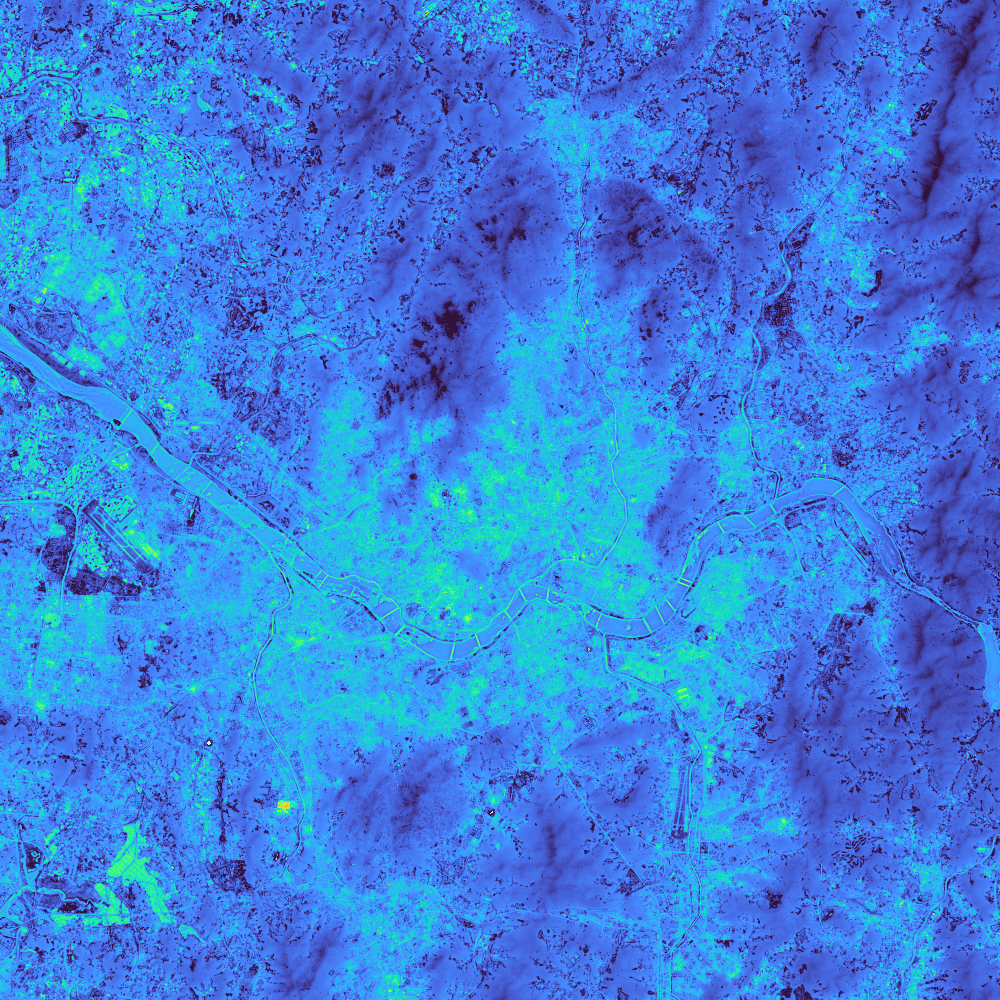
04:00 · Pre-dawn

Simulated surface temperature over 50 × 50 km of Seoul at 04:00; 50 m display preview of the 10 m output

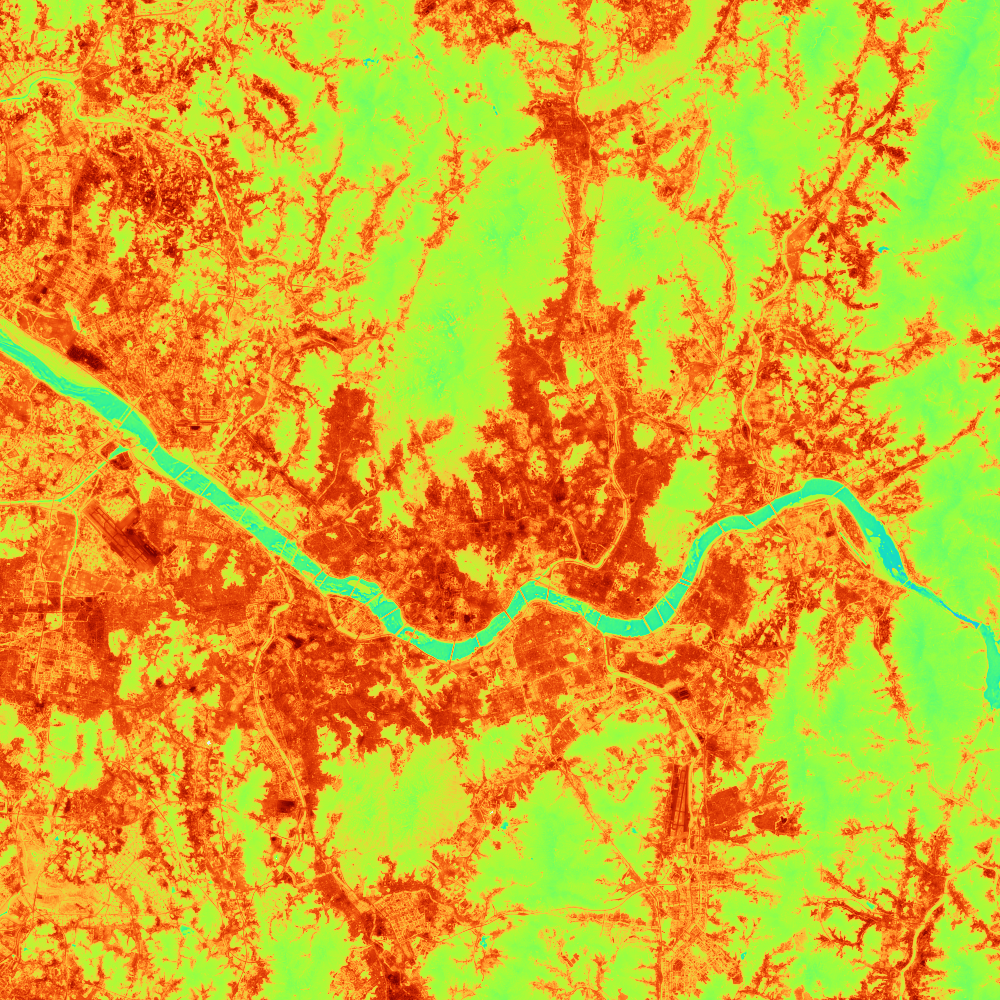
12:00 · Daytime

Simulated surface temperature over the same area at 12:00, using the same 10–50°C colour range
Seoul 50 × 50 km · 31 May 2026 · KSTCommon 10–50°C range · simulated on a 10 m grid

Reconstructing Seoul’s diurnal land surface temperature on a 10 m grid using geostationary and polar-orbiting satellites: preliminary results

Reconstructing a day of temperature changes over Seoul by combining Landsat–Sentinel-2 spatial detail, VIIRS-based thermal response and GK2A temporal information. An exploration of feasibility and validation limits through 25 hourly simulated temperature fields and observational comparisons.

  • GK2A
  • Landsat
  • Sentinel-2
  • VIIRS
  • LST

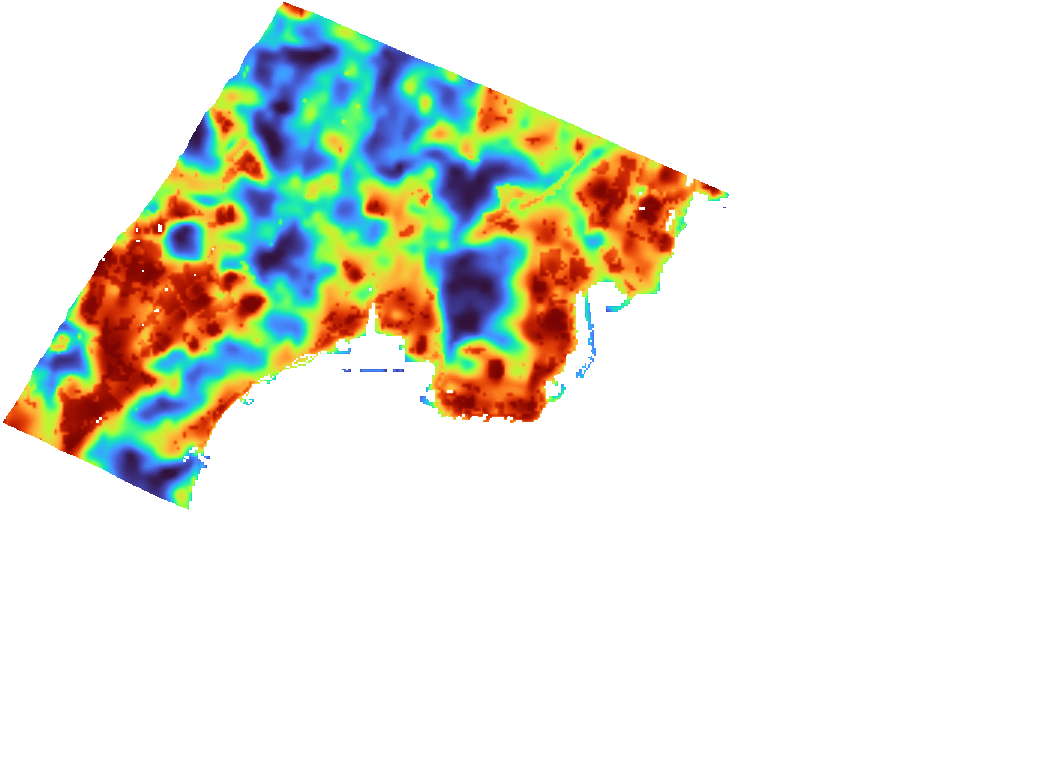
Original Landsat

Original Landsat land-temperature percentiles, 16 October 2023, close-up

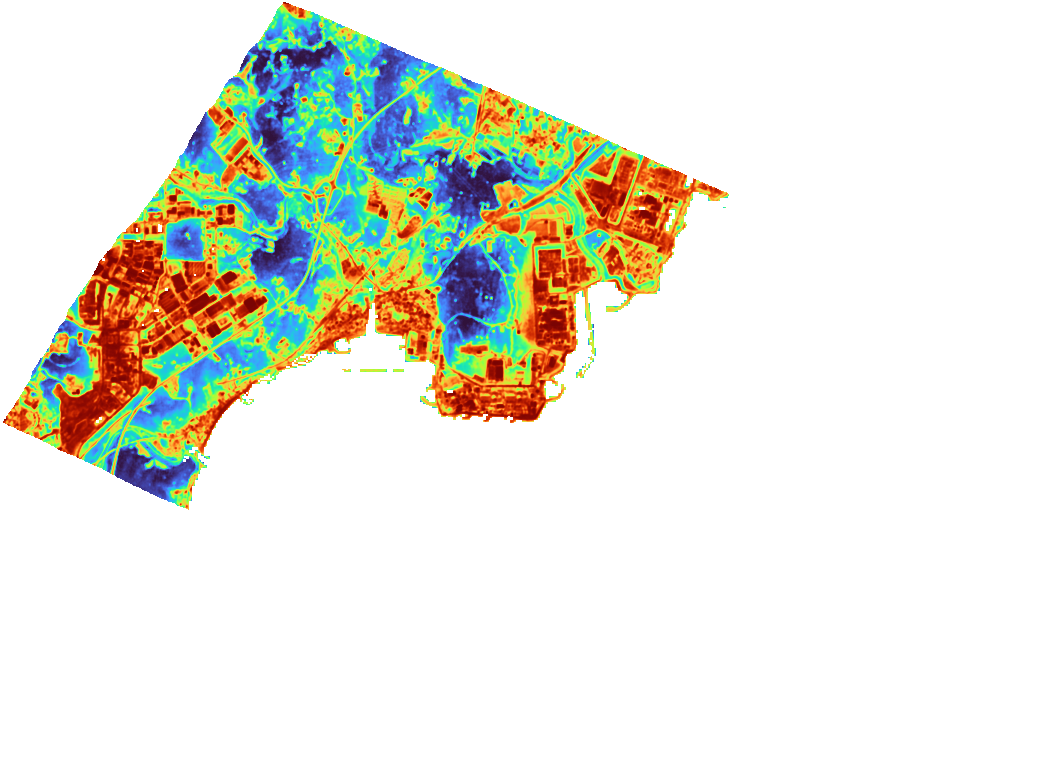
Downscaled · 10 m grid

Initial downscaling over the same area, shown as land-temperature percentiles rather than validated 10 m absolute temperatures
Same-area comparison · 16 Oct 2023Land-temperature percentile per image · not °C

Landsat–Sentinel-2 land surface temperature downscaling to a 10 m grid: a spatial-pattern comparison with HOTSAT

Combining Landsat thermal data with Sentinel-2 optical indices to map surface temperature on a 10 m grid, then comparing spatial patterns with HOTSAT. A note on finer thermal detail, its potential uses, and the limits of validation.
  • Landsat
  • Sentinel-2
  • HOTSAT
  • LST